「Journal of Epidemiology and Community Health誌」に2005年から2006年にかけて掲載された4本の論文。筆頭著者はスウェーデンのルンド大学の社会疫学者であるJuan Merlo教授(リンク)。ちなみに1666年に創立のルンド大学は、ヨーロッパの中でも高い評価を受けている総合大学だ。
この論文の特徴は、とにかく数式を極力減らし図解することで、読者が概念的にマルチレベル分析を理解できるようにしてあるところだ。著者も”approach multilevel regression analysis in a more conceptual than mathematical way”という表現をしている。
■4本の論文
(1) A brief conceptual tutorial of multilevel analysis in social epidemiology: linking the statistical concept of clustering to the idea of contextual phenomenon. Journal of Epidmiology and Community and Health 2005; 59: 443-449
・データセット:
仮想人口集団20000人のSystolic Blood Pressure(収縮期血圧)
・比べているモデル:
[1] Multilevel regression analysis (empty model): independent variablesを一切使用しないモデル。
[2] Single level individual analysis: neighbourhoodの存在を仮定しないモデル。
[3] Single level ecological analysis: neighbourhoodレベルで集計したデータを用いたモデル。
・比較の検証に使用される指標
Between neighbourhoods variance (VN)
Between individual variance (VI)
Intraclass correlation(ICC): VN / VN + VI
Shrinkage factor: 収縮定数/収縮推定量: Level 2におけるランク付けのために使用。Caterpillar plotの作成。
SF = VN / VN + ( VI / Nn)
Nn: the number of people in the neighbourhood
・表示されているグラフ
Fig. 1: “Total variance”, “Individual variance”, “Neighbourhood variance”, “neighbourhood level residual”,
“individual level residual”, “City Mean”の関係を図示したもの。
Fig. 5: Caterpillar plot
(2) A brief conceptual tutorial of multilevel analysis in social epidemiology: investigating contextual phenomena in different groups of people. Journal of Epidmiology and Community and Health 2005; 59: 729-736
・データセット:仮想人口集団20000人のSystolic Blood Pressure
・比べているモデル:
[1] Empty Model
[2] Model with individual variables
Individual variablesには変量効果を仮定していない。
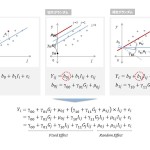
[3] Model with individual variables and random slopes
独立変数と結果変数の関係について変量効果を仮定するモデル。
コミュニティごとに固有の関係が両者について存在すると仮定している。
[4] Model with individual variables, random slopes, and non-constant individual variables
individual level heteroscedasticity(不等分散性)に対応するためのモデル。
反意語は’homoscedasticity'(等分散性)で残差の分散と説明変数とが独立であるという意味。
・比較の検証に使用される指標
Proportional change in variance (PCV): “explained variance”
PCVN = (VN – VN’) / VN
PCVI = (VN – VN’) / VI
・表示されているグラフ:
Fig. 3: interceptとslopeのresidual同士のCorrelation
Correlation = Cov(N-c)・(N-BMI) / (VN-c* VN-BMI)^0.5
Fig. 5: variance participation coefficient (VPC): ICCと類似。
(3) A brief conceptual tutorial of multilevel analysis in social epidemiology: interpreting neighbourhood differences and the effect of neighbourhood characteristics on individual health. Journal of Epidmiology and Community and Health 2005; 59: 1022-1029
・データセット:仮想人口集団20000人のSystolic Blood Pressure
・モデル:
[1] Model with individual variables and complex variance
[2] Model with neighbourhood variables: 地域単位で貧困地域かそうでないか判断し、モデルに組み込む
[3] Model with neighbourhood variables (Cross level interaction)
・比較の検証に使用される指標
Proportional change in variance (PCV)
2 × log-likelihood
・表示されているグラフ:
Fig. 3: Macro-micro relationsの三つの類型化
(4) A brief conceptual tutorial of multilevel analysis in social epidemiology: using measures of clustering in multilevel logistic regression to investigate contextual phenomena. Journal of Epidmiology and Community and Health 2006; 60: 290-297
・データセット:60ヶ所に居住する10723人のスウェーデン人
・モデル:
[1] Empty Model (ロジスティック回帰)
Logit (Pi) = log (Pi / 1 – Pi) = M + EA
ちなみに変形すると、Pi = exp(M + EA) / 1 + exp(M + EA)
[2] Model with individual level variables
[3] Model with neighbourhood level variables
・比較の検証に使用される指標:
PCV
MOR: Median OR
ICC (latent variable method):
ICC (simulation method): ICC = VA / (VA + 3.29)
▼参考にしたウェブサイト
・教育と社会階層